
What the $1M+ Australian private business market is asking for: median multiples, sector benchmarks and the factors that lift a sale price, from 1,684 live listings.
Owners of private Australian businesses typically face an information gap when it comes time to sell. There is limited public record of what businesses like theirs are worth. Sale prices are confidential, databases of completed transactions are patchy at the smaller end of the market, and most owners' expectations are shaped by anecdote (a neighbour's exit, a broker's pitch).
Deal Advisory produced this report to close part of that gap with evidence: a systematic, data-driven picture of how the $1M+ Australian private business market is actually priced today. The report is built from a capture of businesses advertised for sale at $1,000,000+ on AnyBusiness.com.au, one of Australia's largest business-for-sale marketplaces, taken on 12 September 2026.
Two limitations should be noted:
The report is a map of how the market prices itself in public: a benchmark for owners considering an exit, and a starting point for a proper valuation, not a substitute for one.
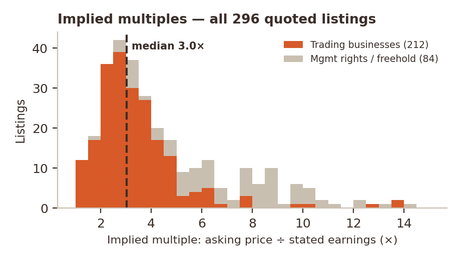

Median implied earnings multiples range from 2.7× for construction, trades and transport to 3.8× for accommodation and tourism.
Chart (hbars): Median implied earnings multiple by sector
Source: Deal Advisory capture of $1M+ listings on AnyBusiness.com.au, 12 September 2026. Retail & fuel (10 listings) and accommodation & tourism (13) are small samples.
76 multiples observed · 2.7× median multiple · $2.25M median asking price
19 multiples observed · 2.9× median multiple · $1.55M median asking price
62 multiples observed · 3.0× median multiple · $1.95M median asking price
10 multiples observed · 3.0× median multiple · $1.50M median asking price
32 multiples observed · 3.2× median multiple · $1.70M median asking price
13 multiples observed · 3.8× median multiple · $2.42M median asking price
212 multiples observed · 3.0× median multiple · $1.95M median asking price
Construction and trades clear at a 2.7× median; health, care and education at 3.2×; accommodation at 3.8×. Recurring, regulated or booking-backed revenue prices higher than project-based work.
Businesses advertised as under management dominate the upper quartile (4×+). Owner-dependence is the most common discount in the market.
$5M+ listings are 3.6× more likely to be under offer than $1–2M listings (9.0% vs 2.5%). Buyer competition concentrates at the scarce, larger end.
Priced listings transact faster: under-offer stock is fresher (38 days median since update vs 52), while P.O.A. listings are the stalest cohort at 67 days.
Get a free, data-backed estimate of what your business could be worth.
Get your free appraisal


